
Climate Change in the Midwest and Great Plains of the United States
Team Member: Catherine Anna Nikiel
Historical Climate: Agricultural Influence
The twentieth century was a period of large-scale, rapid expansion and intensification of agriculture in the Midwest and Great Plains of the United States. Yields of corn and soybean, two summertime staple crops, increased four- to five-fold (Fig. 1), and irrigated and rain-fed cropland areas extended into the Central Plains of the country.
 Figure 1: Weighted average yield of corn and soybean using NASS-USDA survey data on acres and bushels harvested. States used in the average are North Dakota, South Dakota, Nebraska, Kansas, Minnesota, Wisconsin, Iowa, Missouri, Illinois, Indiana, Michigan, and Ohio.
At the same time, observational temperature and precipitation data show that this region experienced a decline in temperature and an increase in precipitation between the periods 1920-1949 and 1970-1999 (Fig. 2).
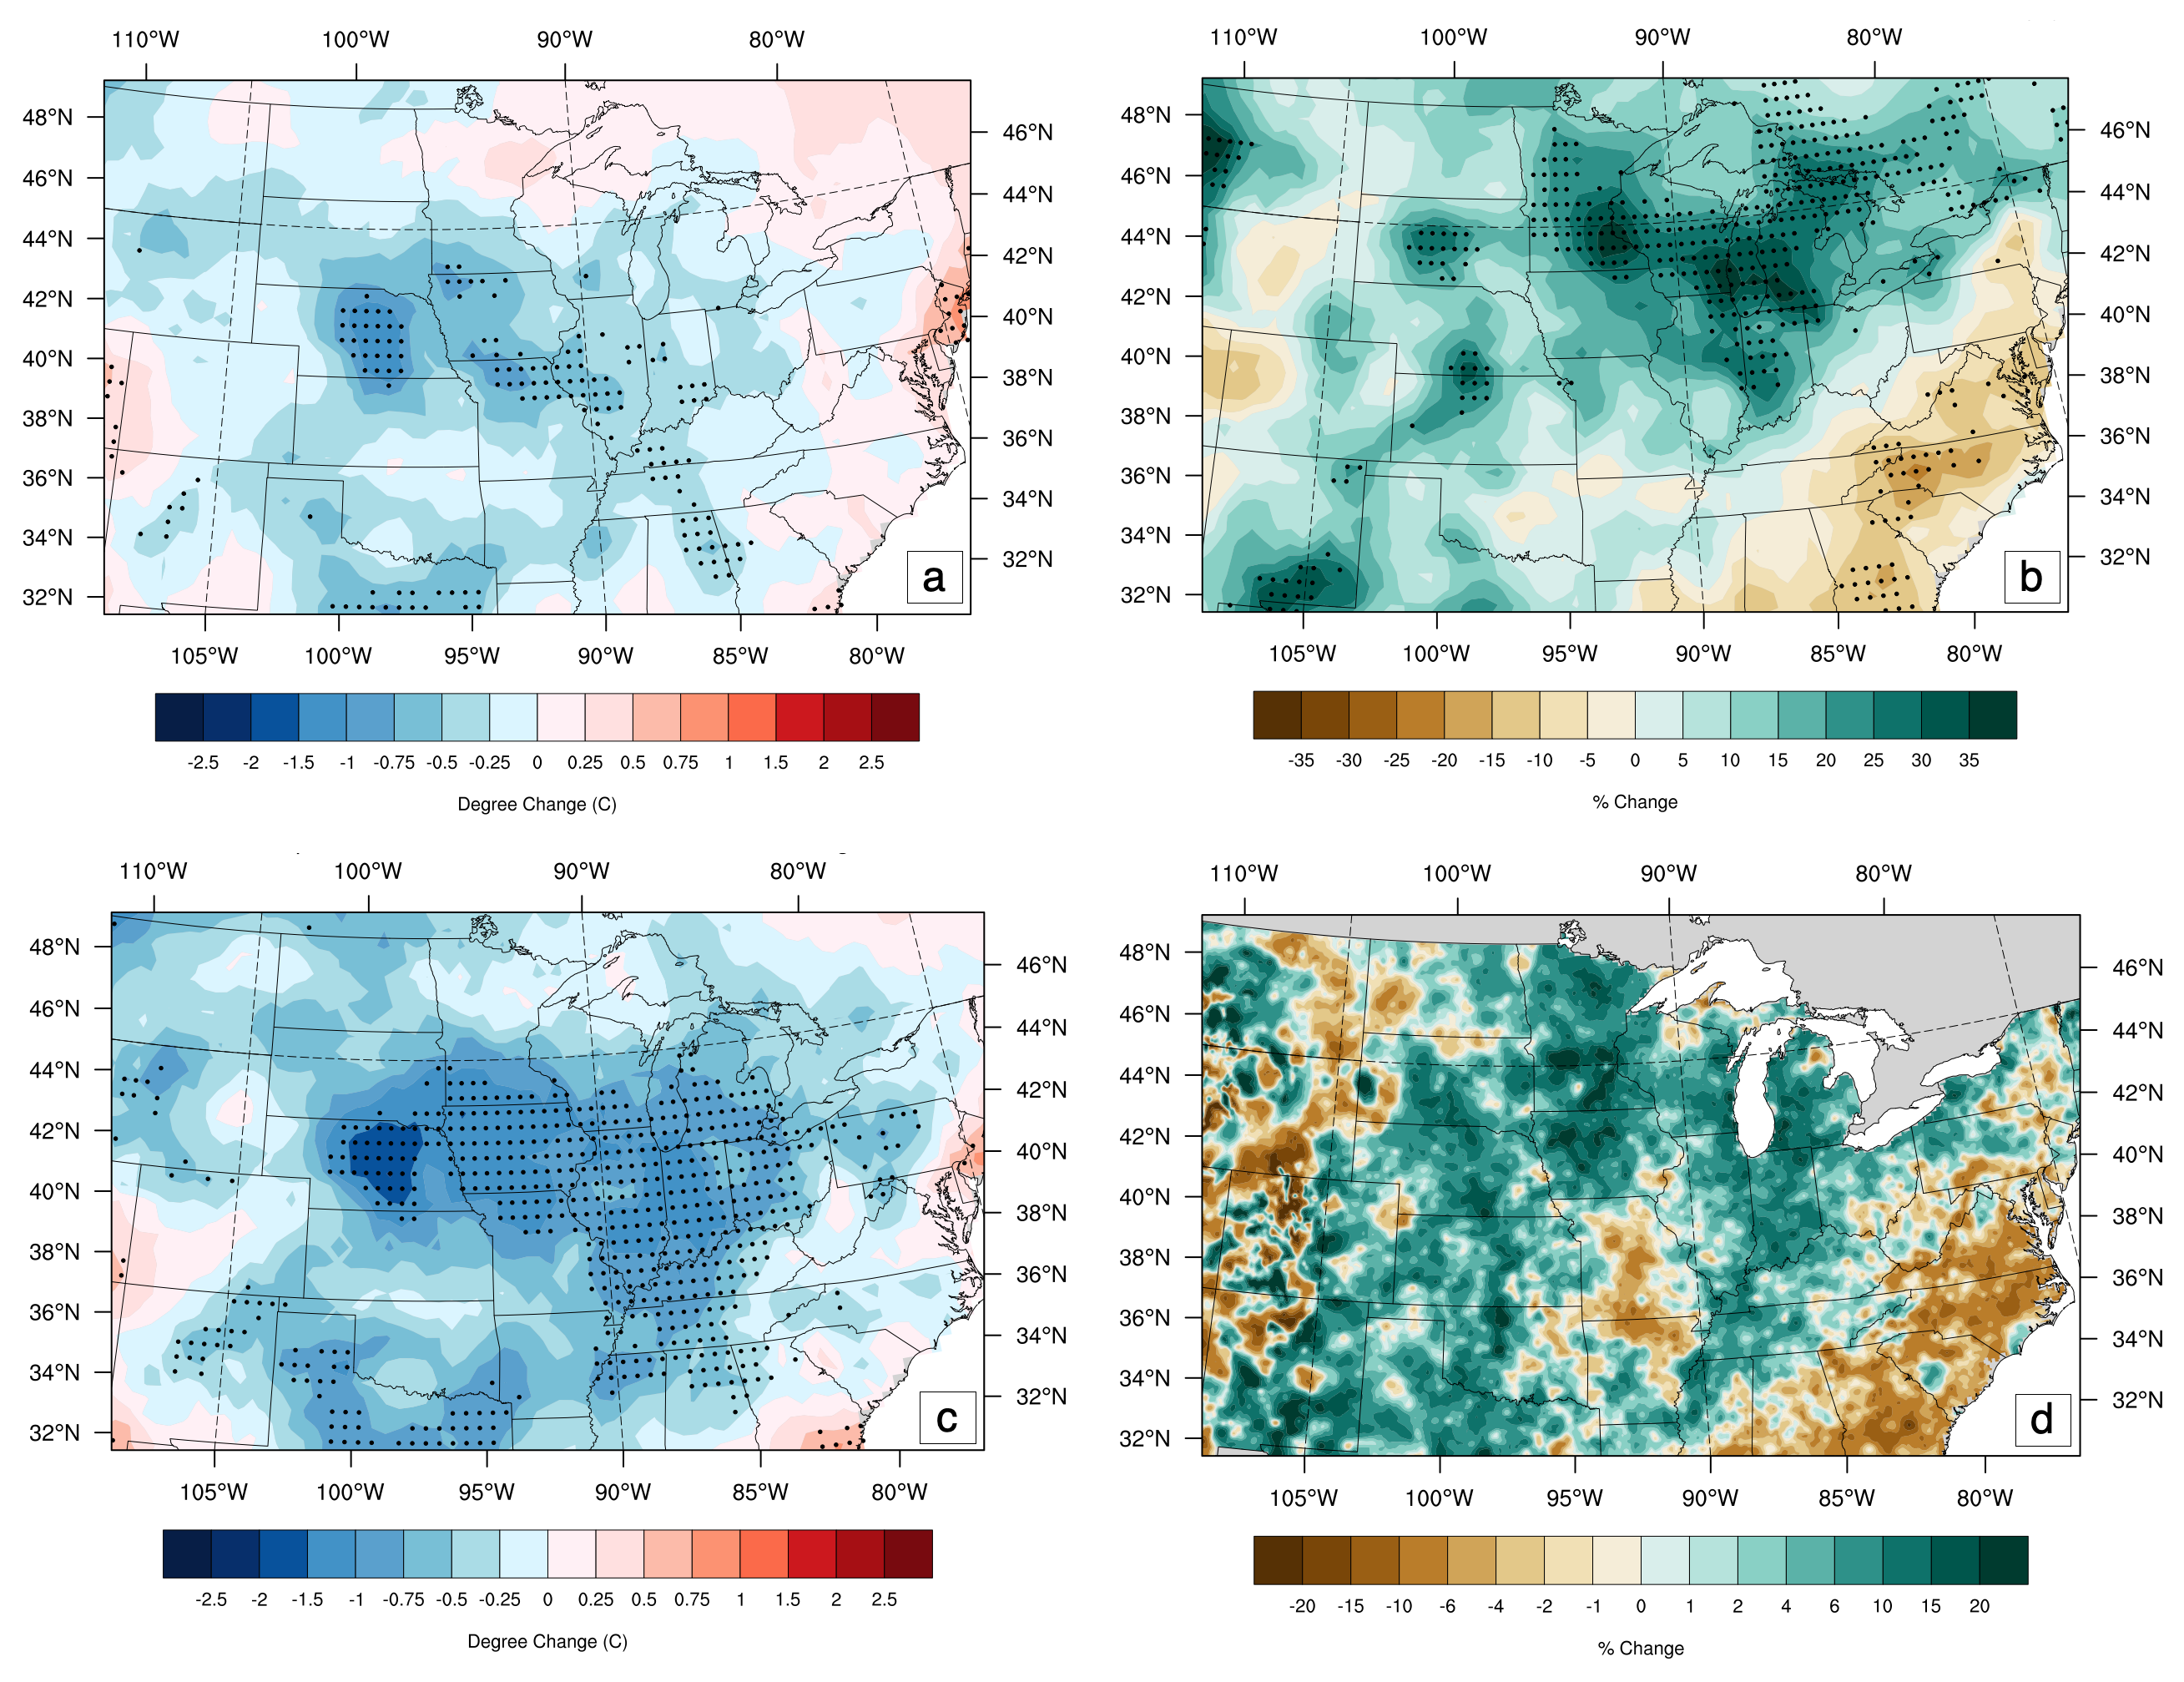 Figure 2: Observed changes in a) Mean surface temperature (CRUTS4.01) b) Precipitation (CRUTS4.01) c) Maximum surface temperature (CRUTS4.02) and d) Evapotranspiration (Livneh et al., 2013). Change shown is the difference between July-August monthly average from 1920-1949 to 1970-1999. Stippling shows a significant change between the two periods according to a KS test at the 5% significance level. (Figure Source: Nikiel and Eltahir, 2019)
This study uses the MIT Regional Climate Model as well as the combination of several observational and reanalysis datasets (CERA20C , LUHv1 , HID , USDA-NASS , PV ) that span the entire 20th century, in order to investigate the relative contributions of agricultural, greenhouse gas increases, and other natural forcings on the observed changes in temperature and precipitation between these pre- and post-development periods.
Results of the study show that temperature changes in this region were strongly influenced by agricultural development, and the influence that the large scale-change land-use has on surface moisture and energy balance. Importantly, the agricultural change is comprised of several components – intensification, and the expansion of both rainfed and irrigated cropland areas. The drivers of precipitation change form a more complex combination, where agricultural, GHG, and SST patterns play a role in the observed changes (Fig. 3).
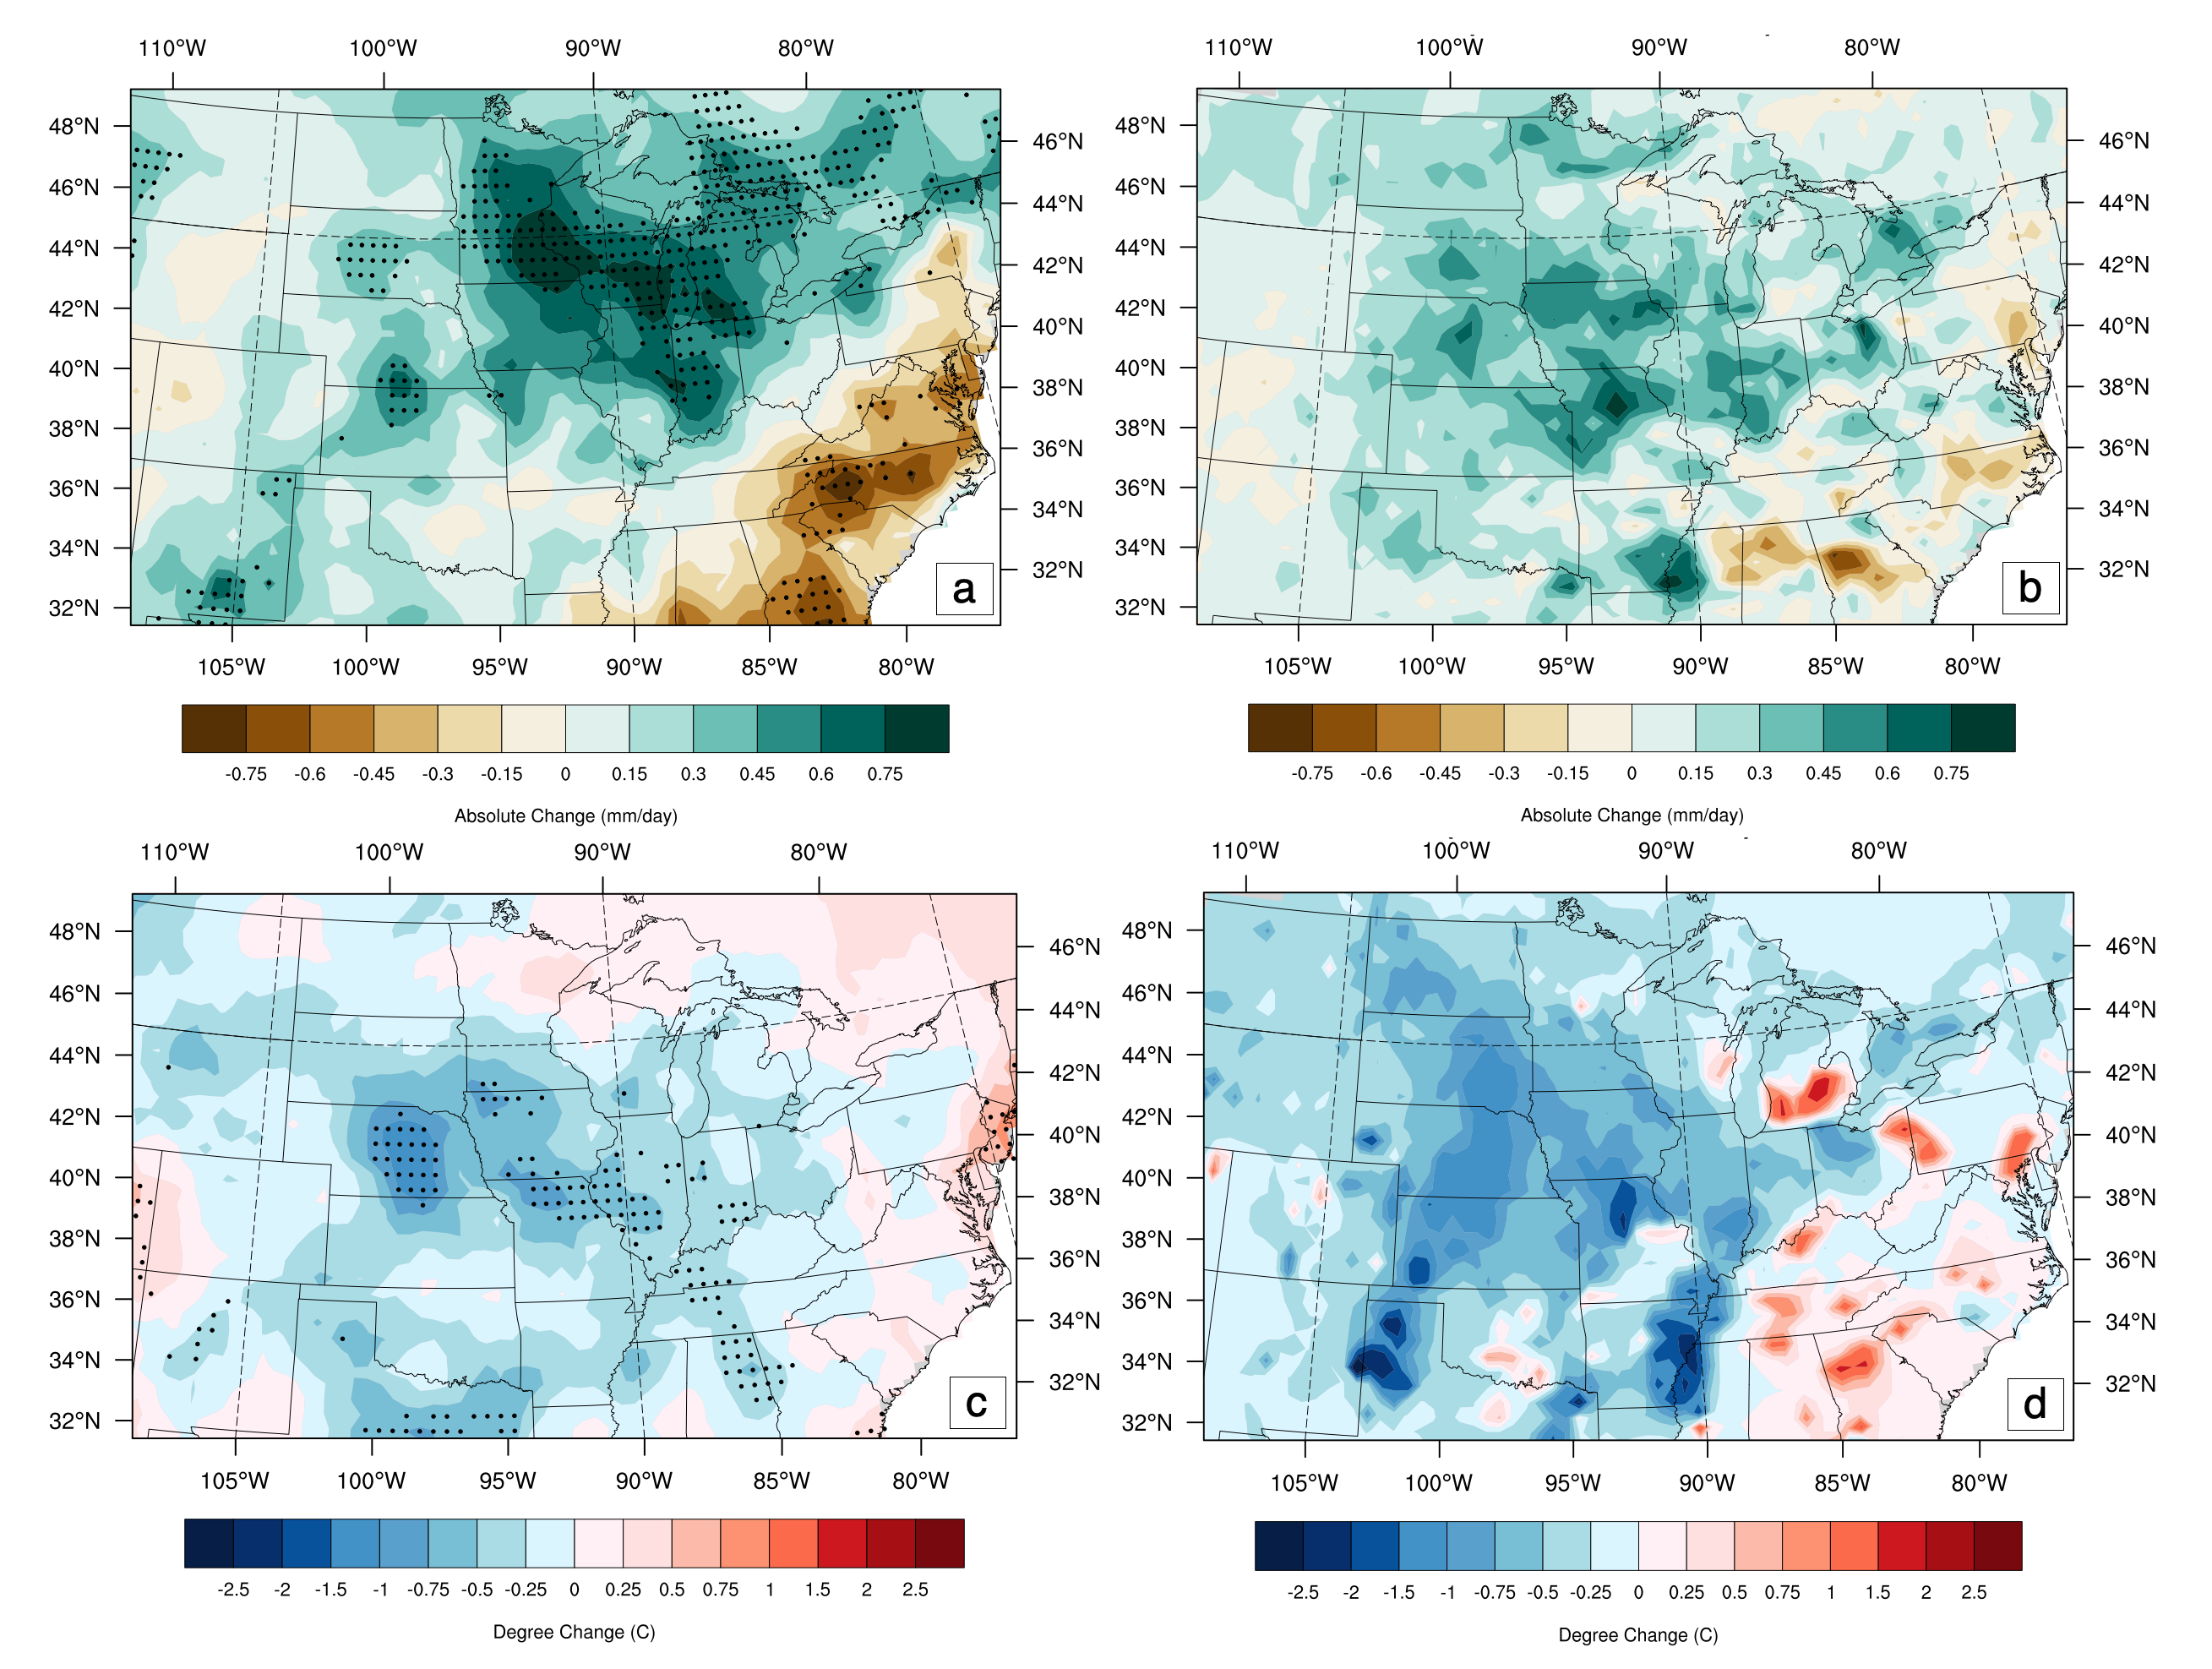 Figure 3: a) Observed July-August precipitation change (mm/day) from 1920-1949 to 1970-1999 in CRU data. b) Composite precipitation change in the same period from simulated vegetation and GHG impacts as well as estimated SST influence (individual components shown in Figure 5c-e) c) Observed July-August temperature change (degrees C) from 1920-1949 to 1970-1999 in CRU data. d) Composite temperature change in the same period from simulated vegetation and GHG impacts as well as estimated SST influence (individual components shown in Figure 4c-e). (Figure Source: Nikiel and Eltahir, 2019)
More detailed information on the study and results can be found in the following paper:
, 2019: Summer Climate Change in the Midwest and Great Plains due to Agricultural Development during the Twentieth Century. J. Climate, 32,5583–5599, https://doi.org/10.1175/JCLI-D-19-0096.1
Future Change: Heat Waves and Droughts
Current work focuses on the occurrence of humid heat waves and large-scale multi year drought in the historical climate, as well as changes in their frequency, intensity, and duration in the future climate. The Dust Bowl drought of the 1930’s was one of the most extensive, intense, long duration droughts in the observational record and provides a reasonable benchmark to study future drought (Fig. 4).
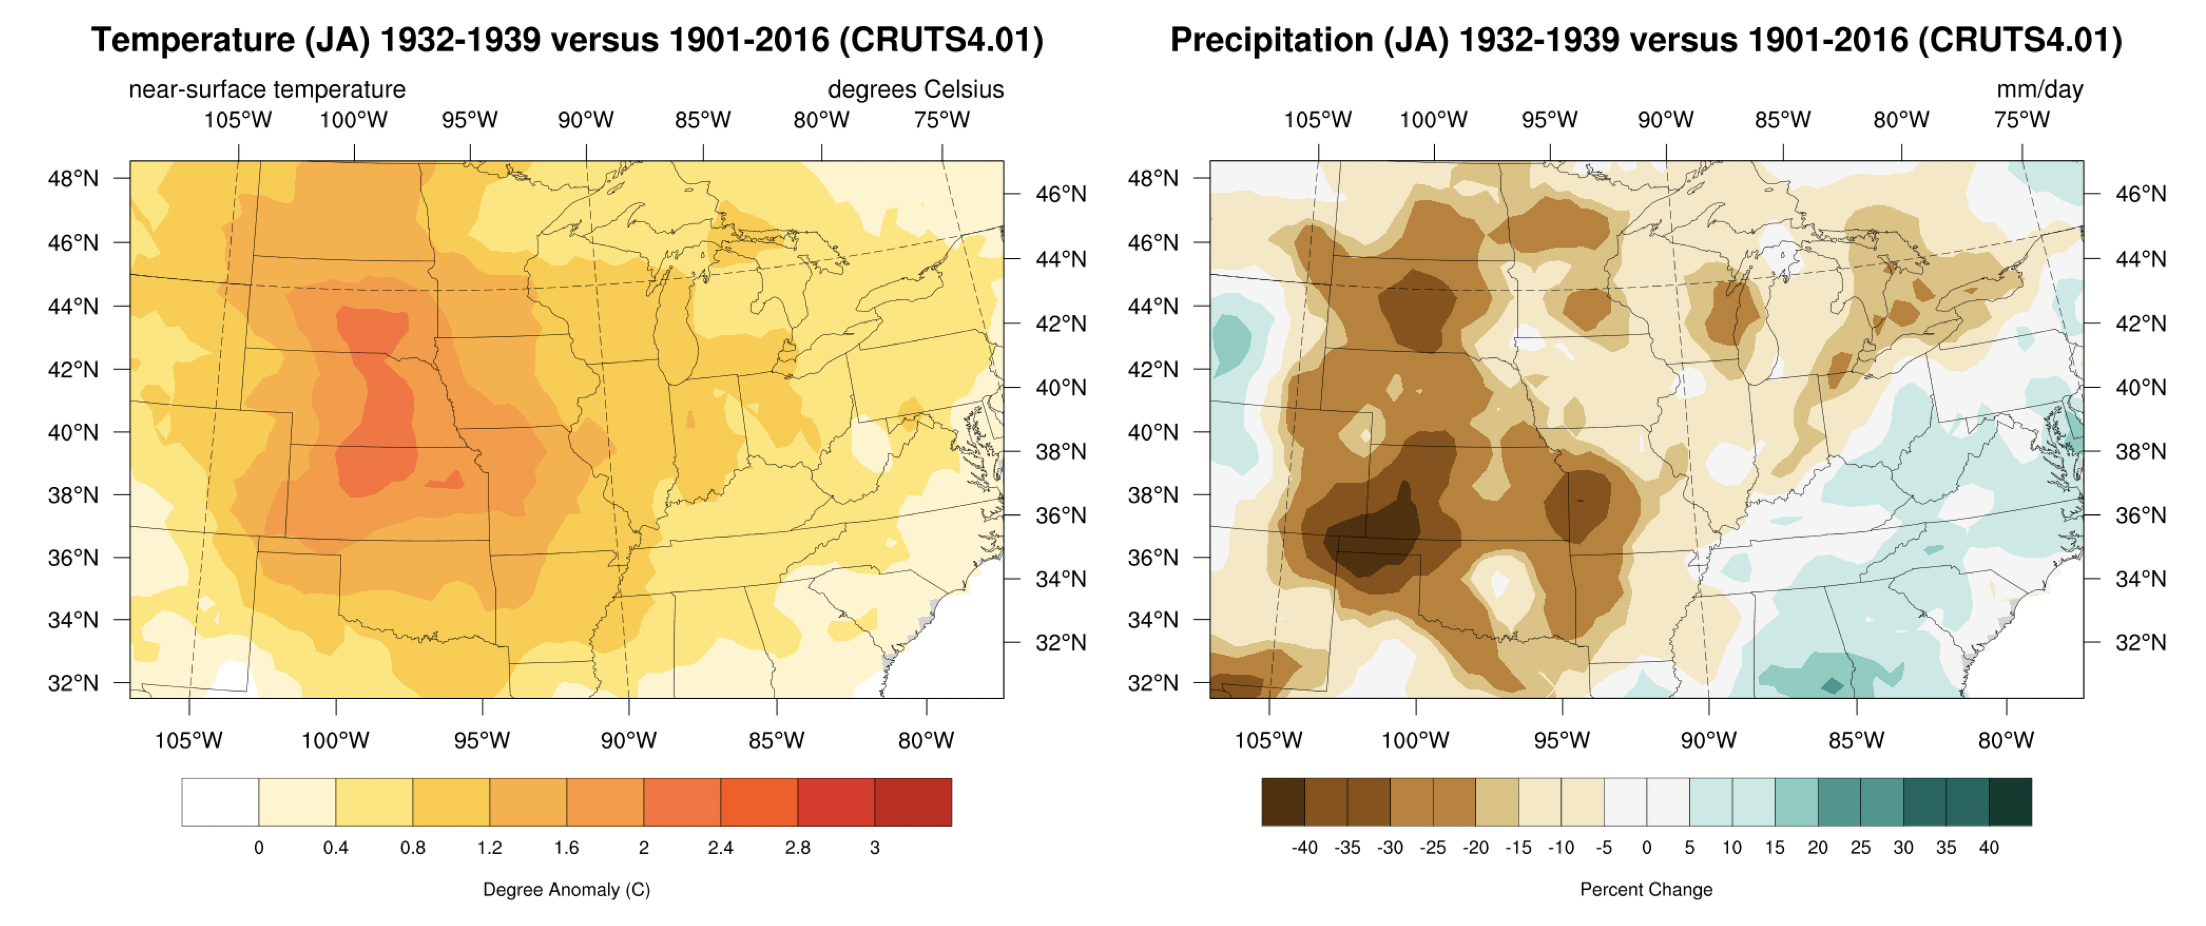 Figure 4: Observed Temperature and Precipitation in 1932-1939 period versus 1901-2016 for July-August Averages. (Data source: CRUTS4.01)
Analysis of GCM data from the CMIP5 archive, as well as new nested runs using MRCM model will provide insights into the characteristics of droughts and heat waves in the future, and our ability to correctly capture their formation and development in model simulations. This work is necessary to protect the large populations living in these areas, as climate change will expose entire new communities to potentially life-threatening conditions.
References
LIVNEH, B., E. A. Rosenberg, C. Lin, B. Nijssen, V. Mishra, K. M. Andreadis, E. P. Maurer, and D. P. Lettenmaier, 2013: A long-term hydrologically based dataset of land surface fluxes and states for the conterminous United States: Update and extensions. Journal of Climate, 26 (23), 9384–9392, doi:10.1175/JCLI-D-12-00508.1.
HARRIS, I., P. D. Jones, T. J. Osborn, and D. H. Lister, 2014: Updated high-resolution grids of monthly climatic observations – the CRU TS3.10 dataset. International Journal of Climatology, 34 (3), 623–642. Data retrieved from https://crudata.uea.ac.uk/cru/data/hrg/, doi:10.1002/joc. 3711.
, 2019: Summer Climate Change in the Midwest and Great Plains due to Agricultural Development during the Twentieth Century. J. Climate, 32,5583–5599, https://doi.org/10.1175/JCLI-D-19-0096.1